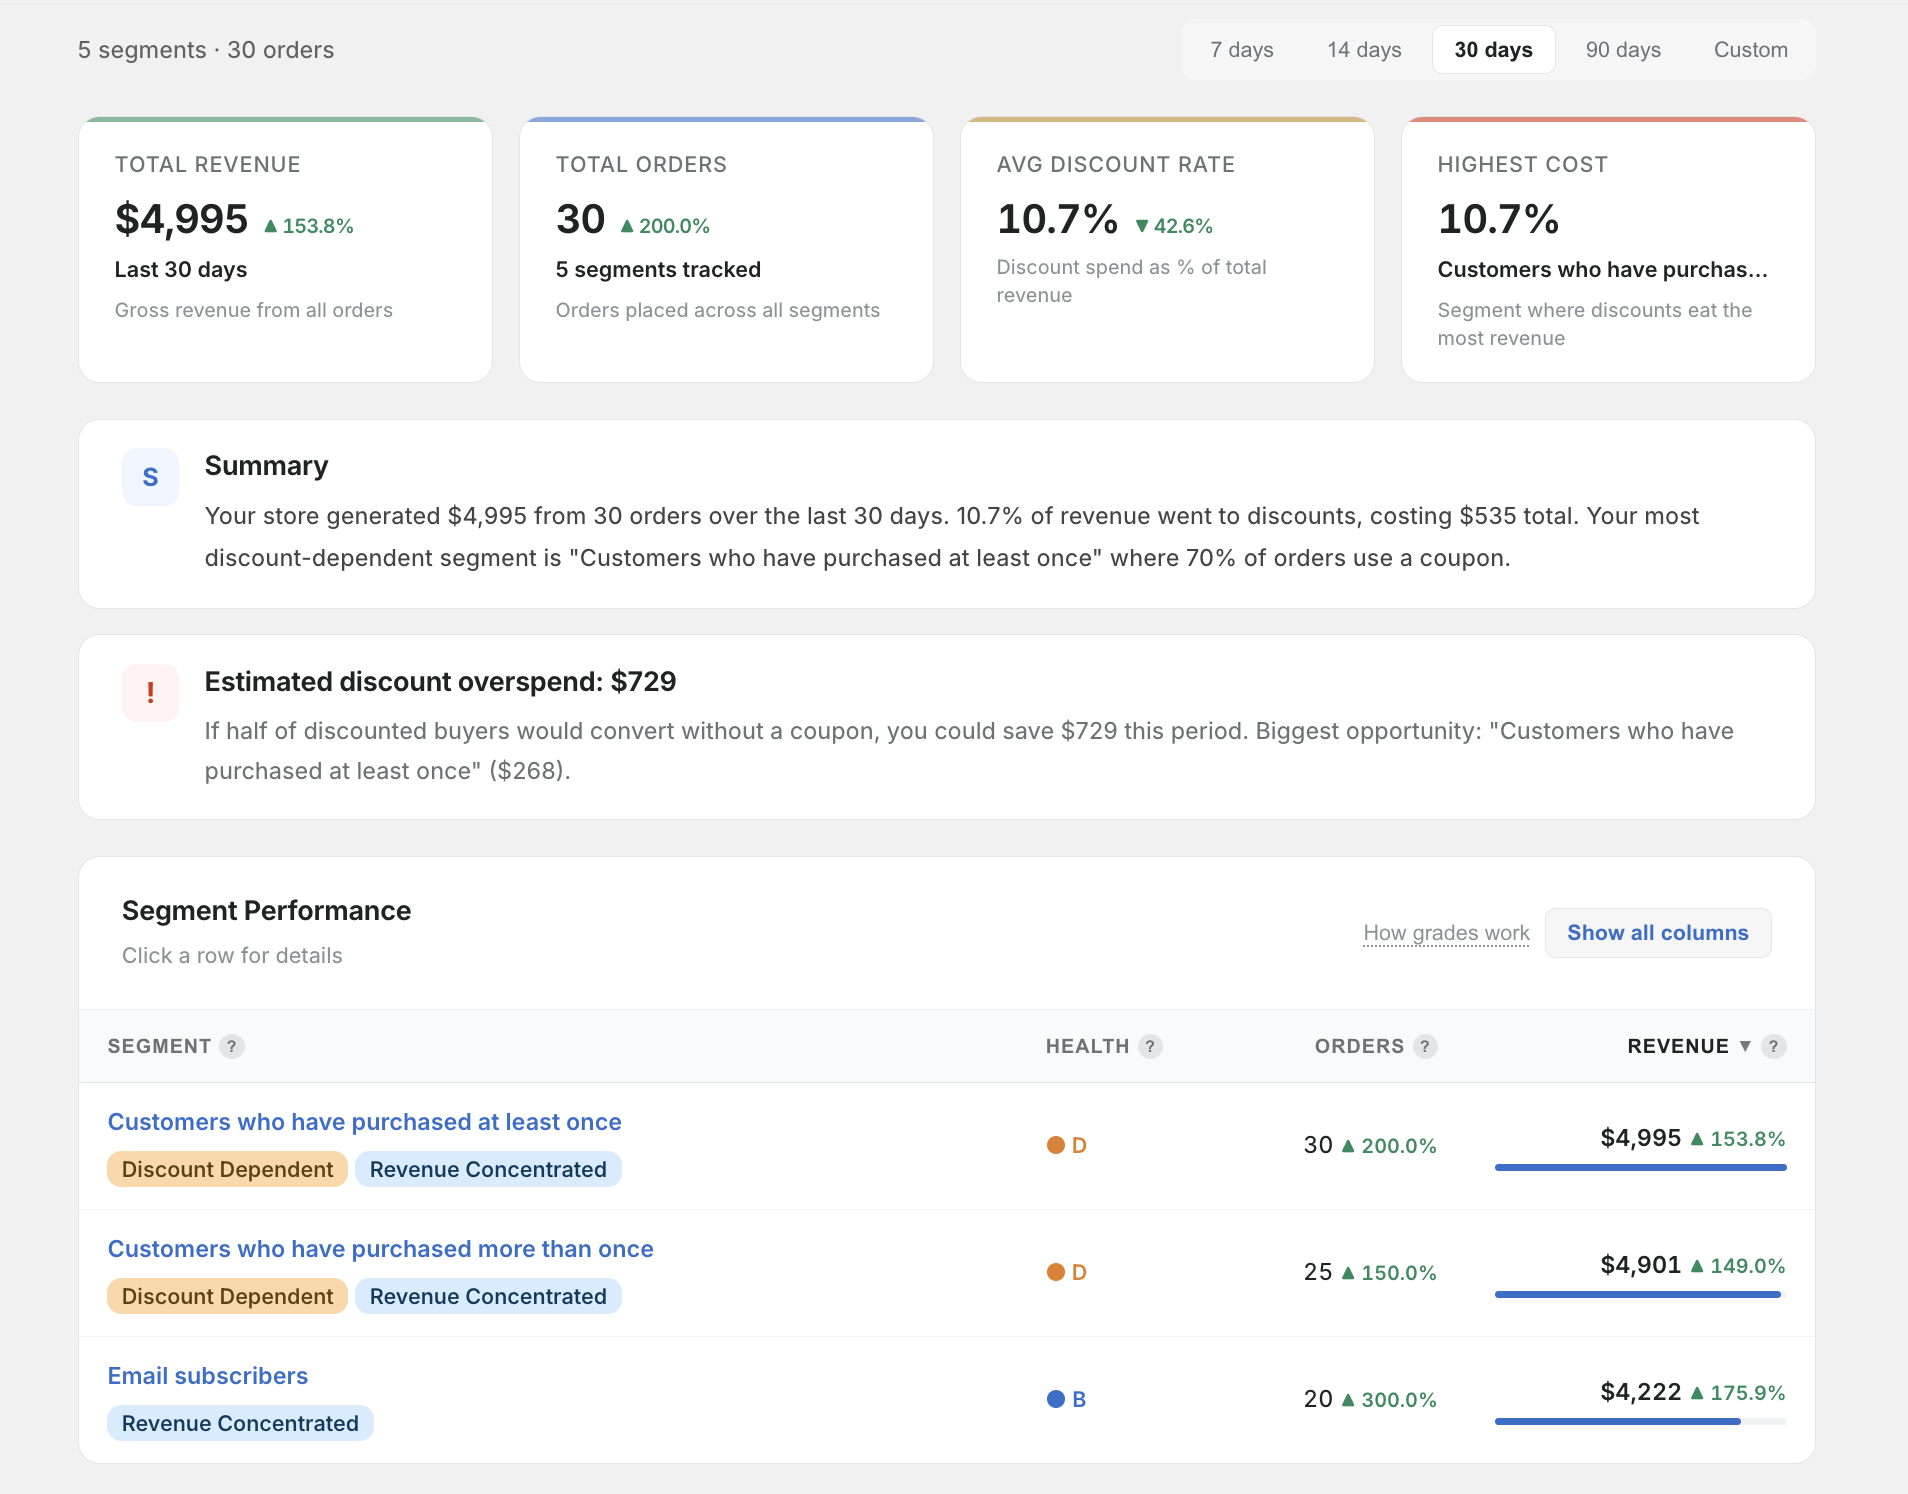
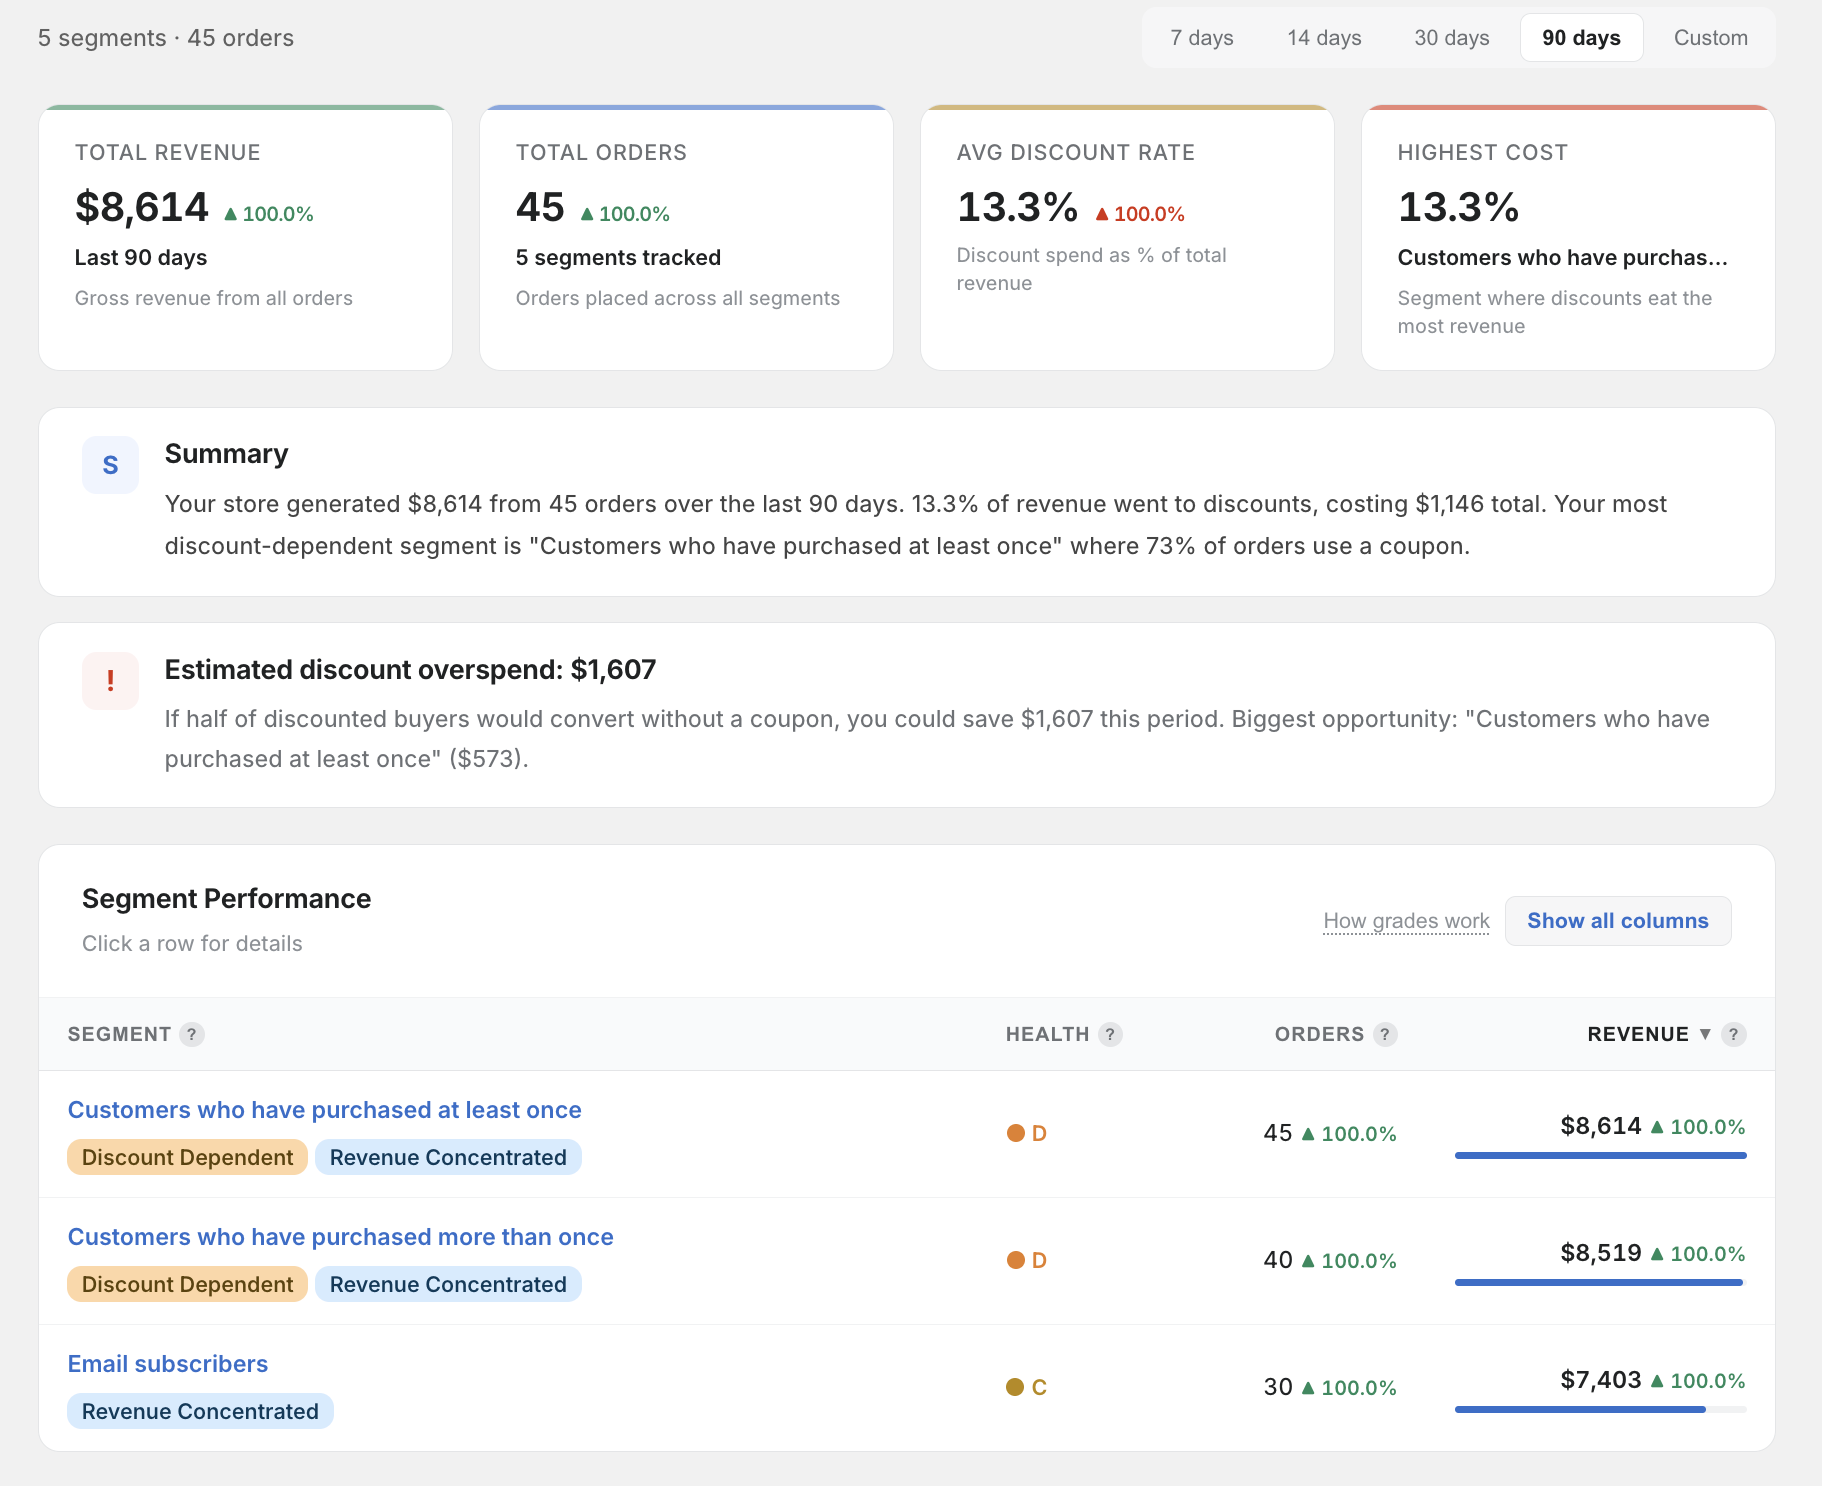
Dashboard Overview
The SegmentIQ dashboard gives you a complete picture of how discounts perform across your customer segments.
Layout
The dashboard is divided into three main sections:
1. Summary Bar
At the top of the page, you'll see:
- Total segments — how many customer segments SegmentIQ is tracking
- Total orders — the number of orders analysed in the current date range
- Date range — the currently selected time period (default: 30 days)
- Last synced — when data was last updated from your store
2. Segment Cards
Each customer segment gets its own card showing:
- Segment name — as defined in your Shopify admin
- Key metrics — revenue, orders, AOV, discount rate, and more
- Insight badges — colour-coded alerts highlighting important findings
- Click to expand — opens a detailed modal with full metrics and discount code breakdown
3. Revenue Concentration Chart
A visual breakdown of how your total revenue is distributed across segments. See Charts for details on how to read it.
Data Freshness
SegmentIQ syncs data daily. You can also trigger a manual re-sync from the Settings page. The dashboard always shows pre-computed metrics — it never runs heavy calculations while you're viewing the page, so it loads fast.