Your First Dashboard
Once the initial sync completes, you'll be redirected to the SegmentIQ dashboard. Here's what to expect.
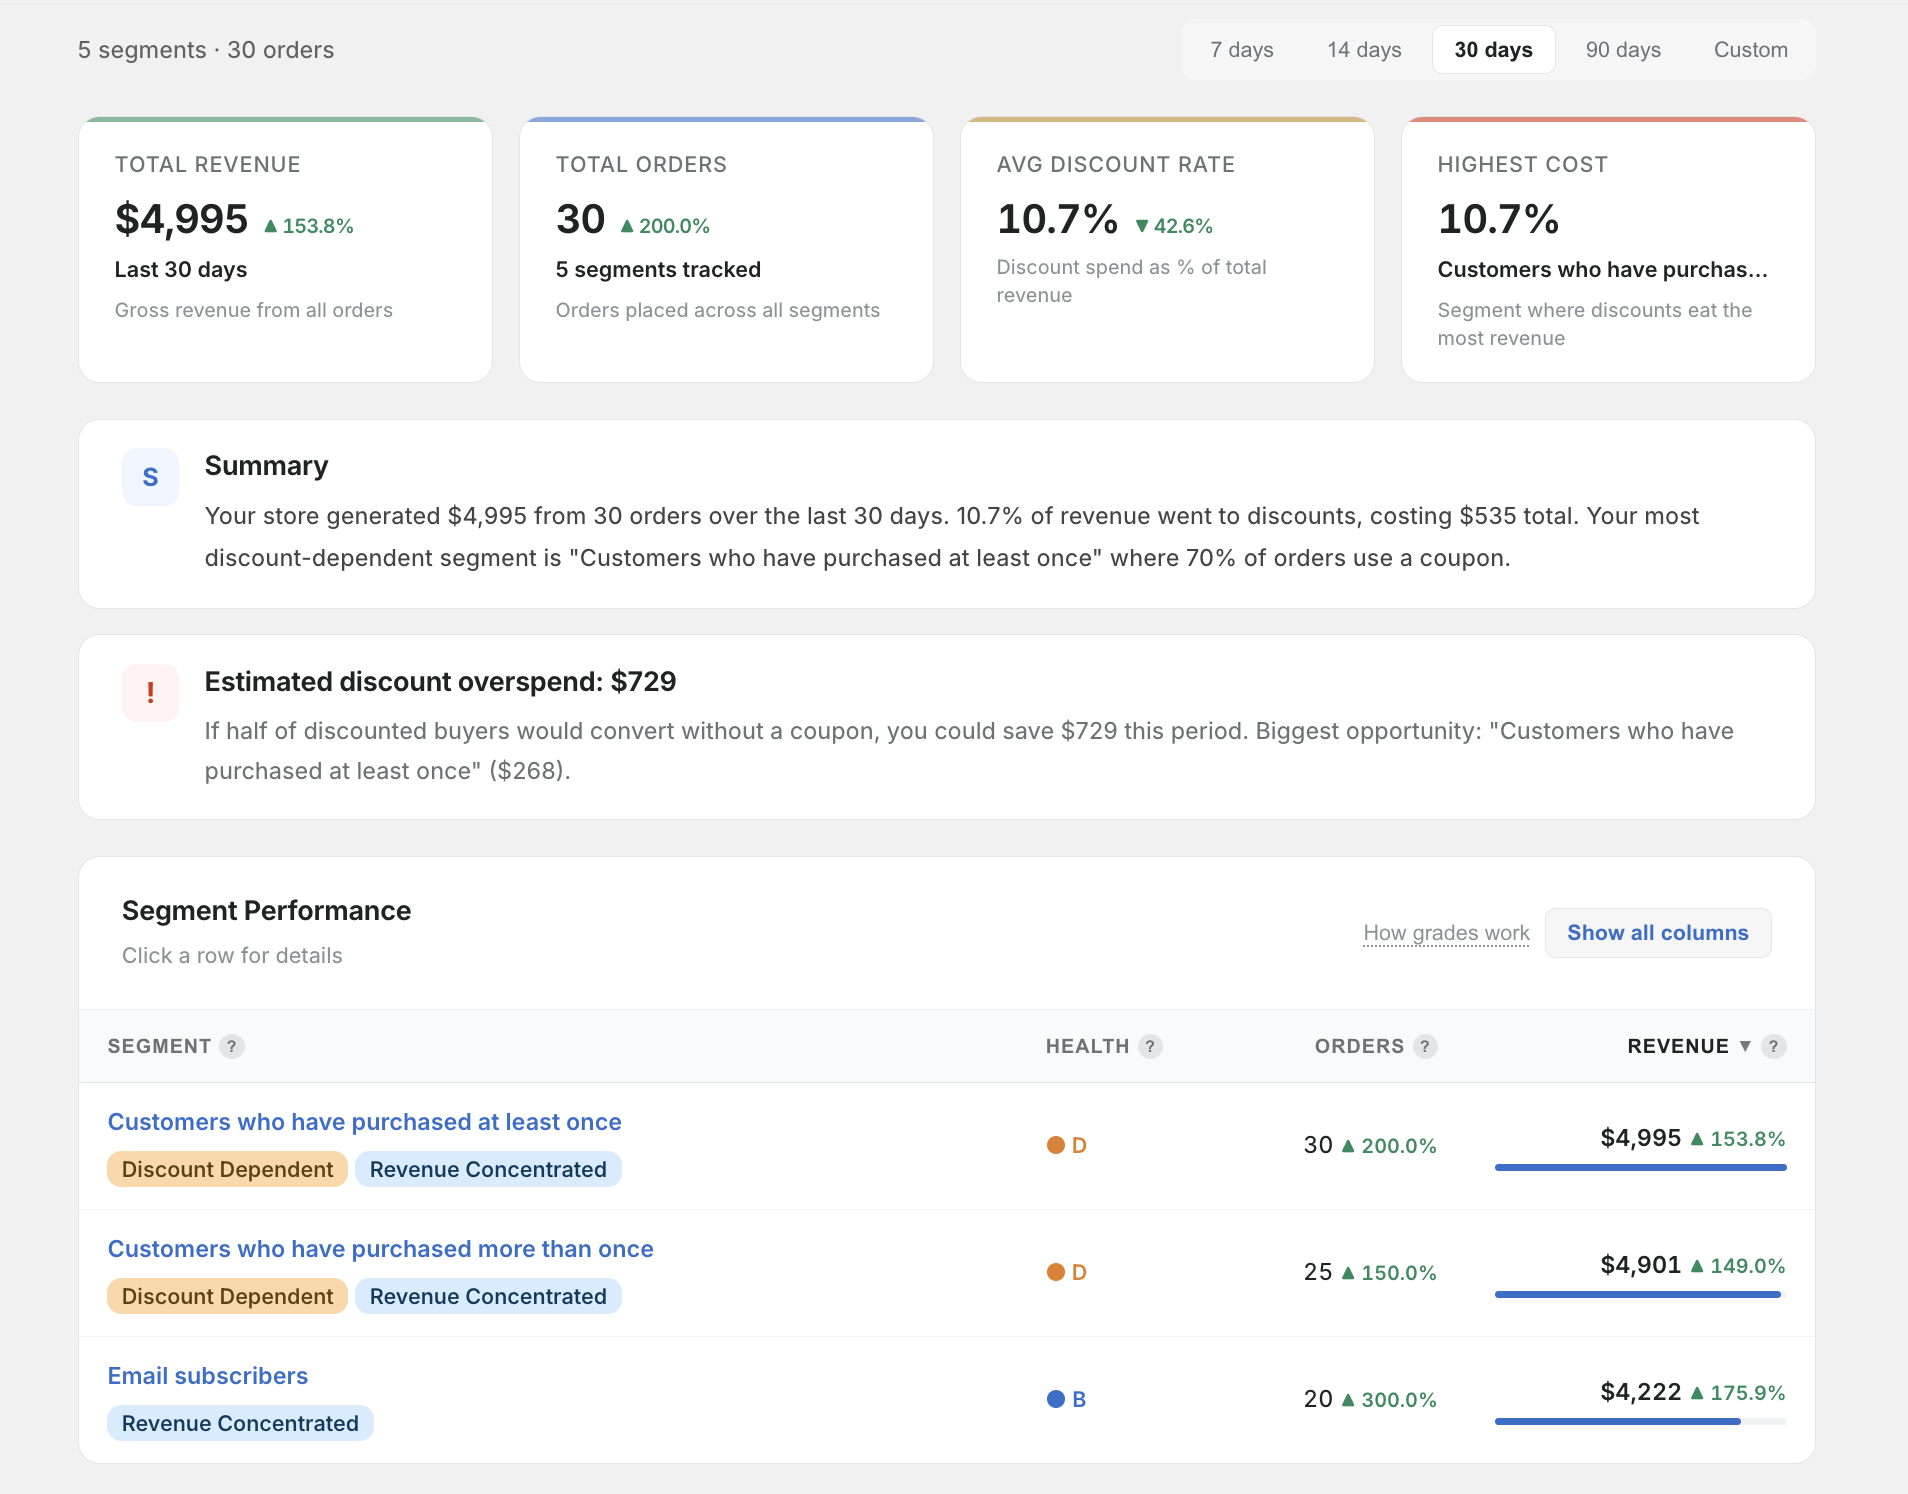
Dashboard Tour
The dashboard shows a summary of all your customer segments and their discount performance:
- Summary cards at the top show total segments, total orders analysed, and the active date range
- Segment cards below show each segment with its key metrics and any generated insights
- Revenue concentration chart visualises how revenue is distributed across segments
"No Data" Scenarios
If parts of the dashboard appear empty, here's what might be going on:
No segments found
Your store doesn't have any customer segments defined yet. Go to Customers → Segments in your Shopify admin to create segments.
No orders in date range
There are no orders in the selected date range. Try expanding the range using the date picker (e.g. switch from 7 days to 30 or 90 days).
No discounted orders
Your segments have orders, but none of them used discount codes. This is actually useful information — it means your segments aren't relying on discounts.
Segments with too few orders
If a segment has fewer than 20 orders in the selected period, insights may be limited. SegmentIQ needs a minimum sample size to generate reliable metrics.