Charts
Below the Segment Performance table, Home shows two charts for the selected period.
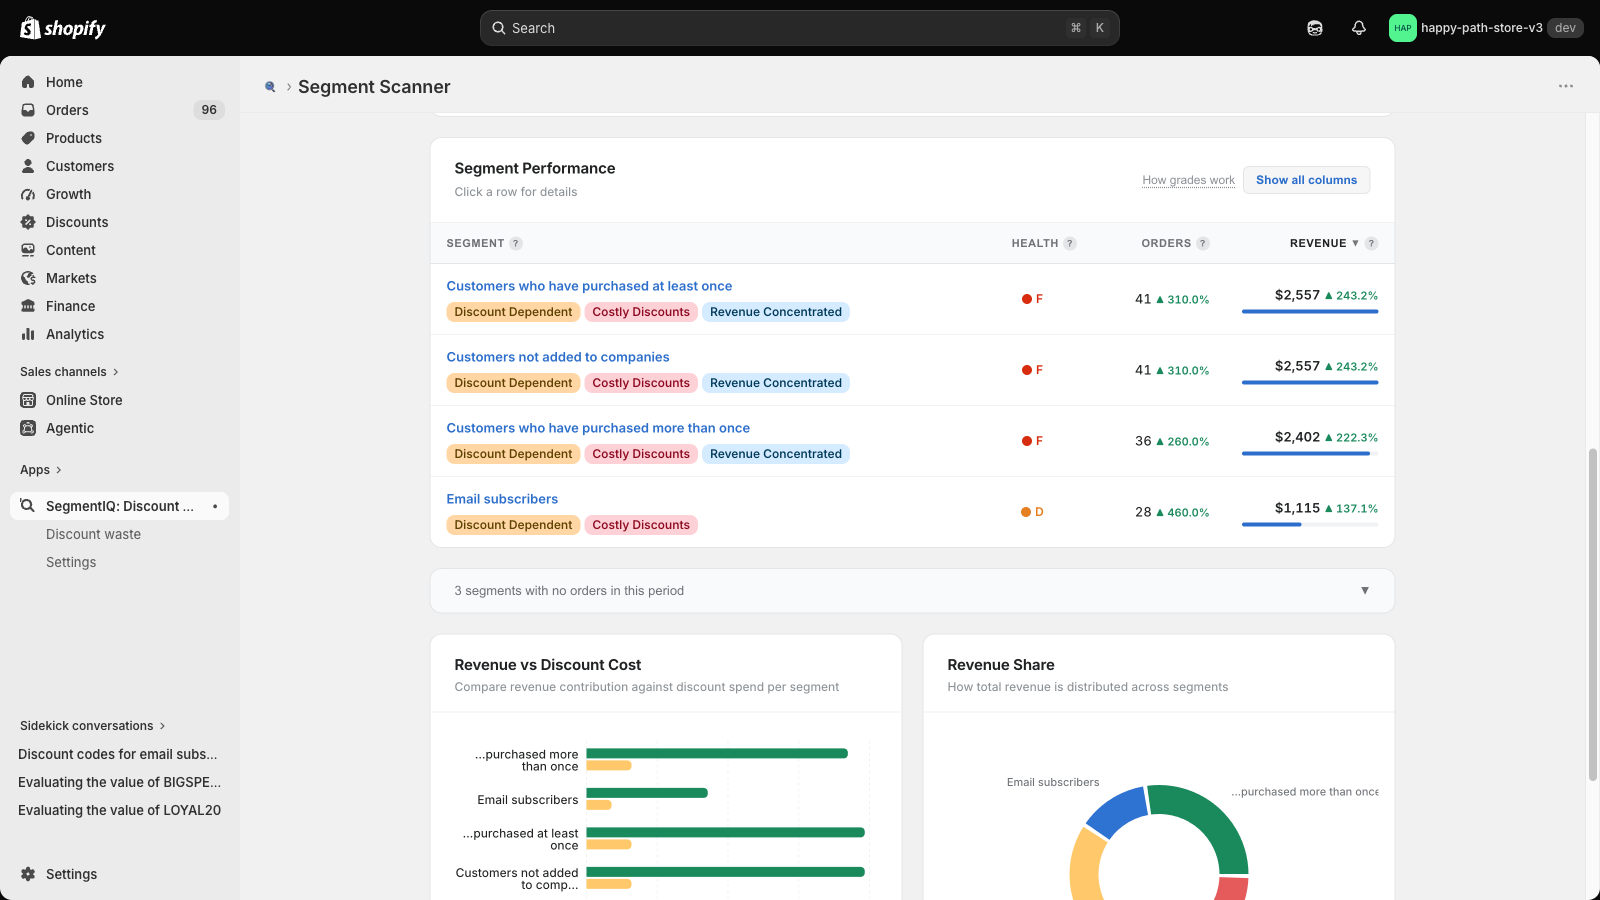
Revenue vs Discount Cost
One pair of bars per segment: the segment's revenue and its discount cost.
- A long revenue bar with a short discount bar means the segment brings in revenue without leaning on discounts
- A discount bar that's large compared with revenue means discounts take a big share of what that segment spends
Revenue Share
A donut chart of how revenue is spread across segments.
- Spread across several segments — revenue doesn't depend on one group of customers
- One segment dominates — a change in that segment's behaviour would have a big effect; see the Revenue Concentrated badge in Insights
Good to know
Segments can overlap. A customer can belong to several segments (for example "Email subscribers" and "Customers who have purchased more than once"), so shares can add up to more than 100%.