Discount Report (Pro)
The discount report shows where your discount spend went over the last 180 days, for every discount code and every customer segment. It's part of the Pro plan and appears in the app menu as Discount waste.
On the free plan, Home shows a verdict for your biggest discount code over the last 90 days instead. A code needs at least 10 redemptions to get a verdict.
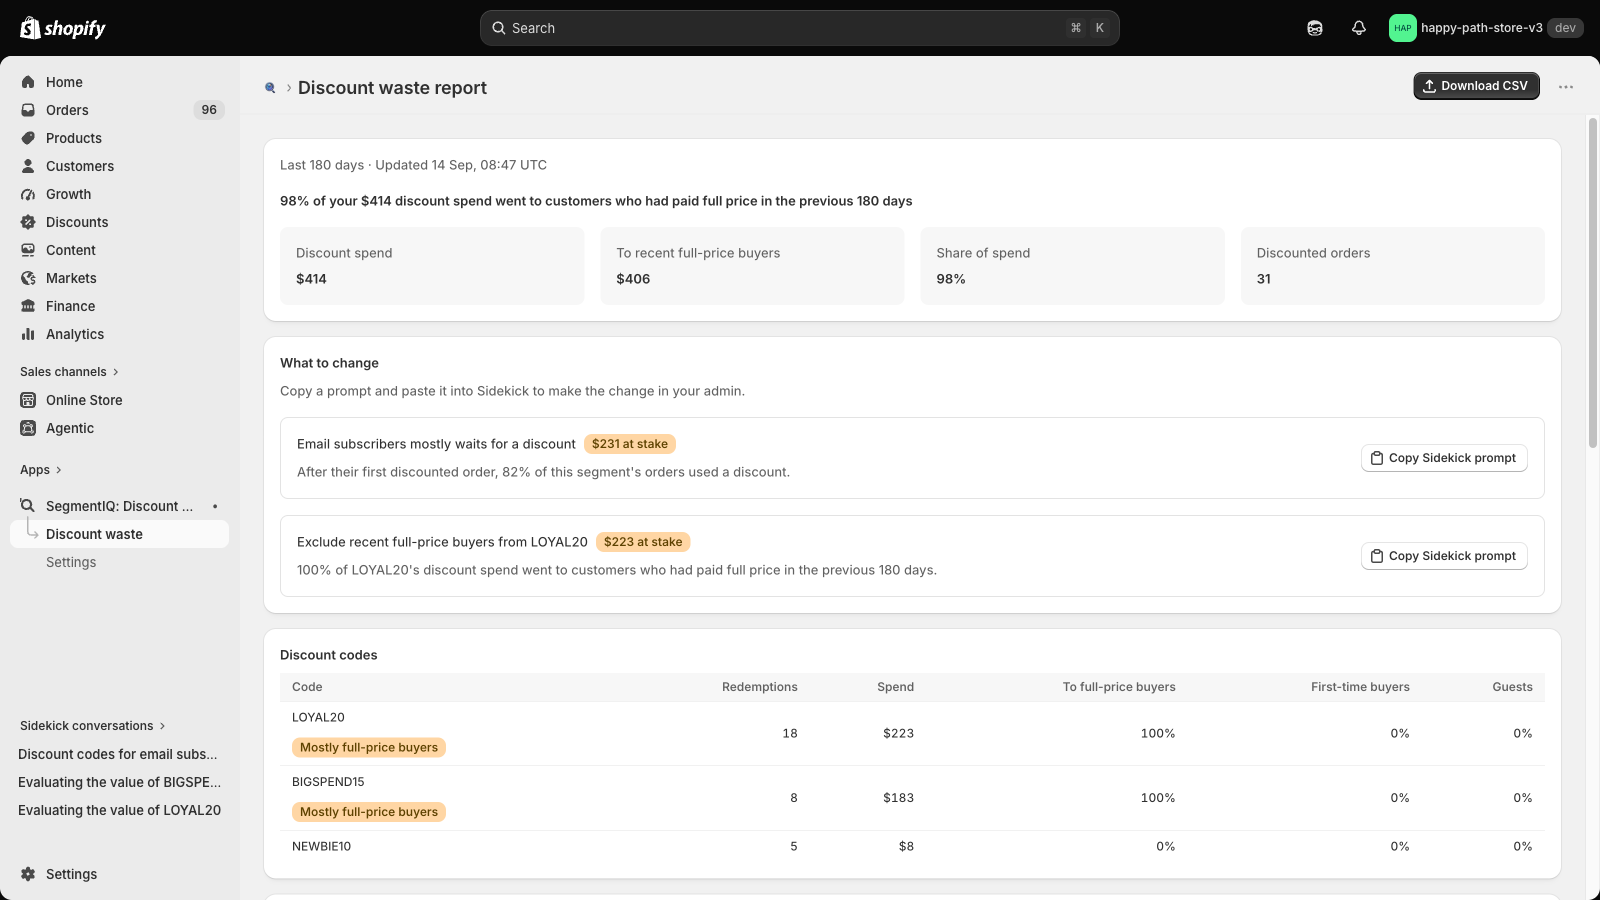
Summary
The top of the report shows:
- Discount spend — the total discount given on orders in the last 180 days
- To recent full-price buyers — how much of that went to customers who had paid full price in the previous 180 days
- Share of spend — the same figure as a percentage
- Discounted orders — how many orders used a discount
What to change
A short list of suggestions based on your data, each with the amount of discount involved. For example, excluding recent full-price buyers from a code, or looking at a segment that keeps waiting for a discount.
Each suggestion has a Copy Sidekick prompt button. Paste the prompt into Shopify Sidekick to make the change in your admin. SegmentIQ itself never changes your store.
Discount codes
One row per discount code, including automatic discounts:
| Column | What it means |
|---|---|
| Redemptions | Orders that used the code |
| Spend | Total discount given through the code |
| To full-price buyers | Share of the code's spend that went to customers who had paid full price in the previous 180 days |
| First-time buyers | Share of redemptions that were the customer's first order |
| No customer | Share of redemptions with no customer attached, such as some point-of-sale or draft orders. Online guest checkouts still create a customer, so they appear as first-time or returning buyers |
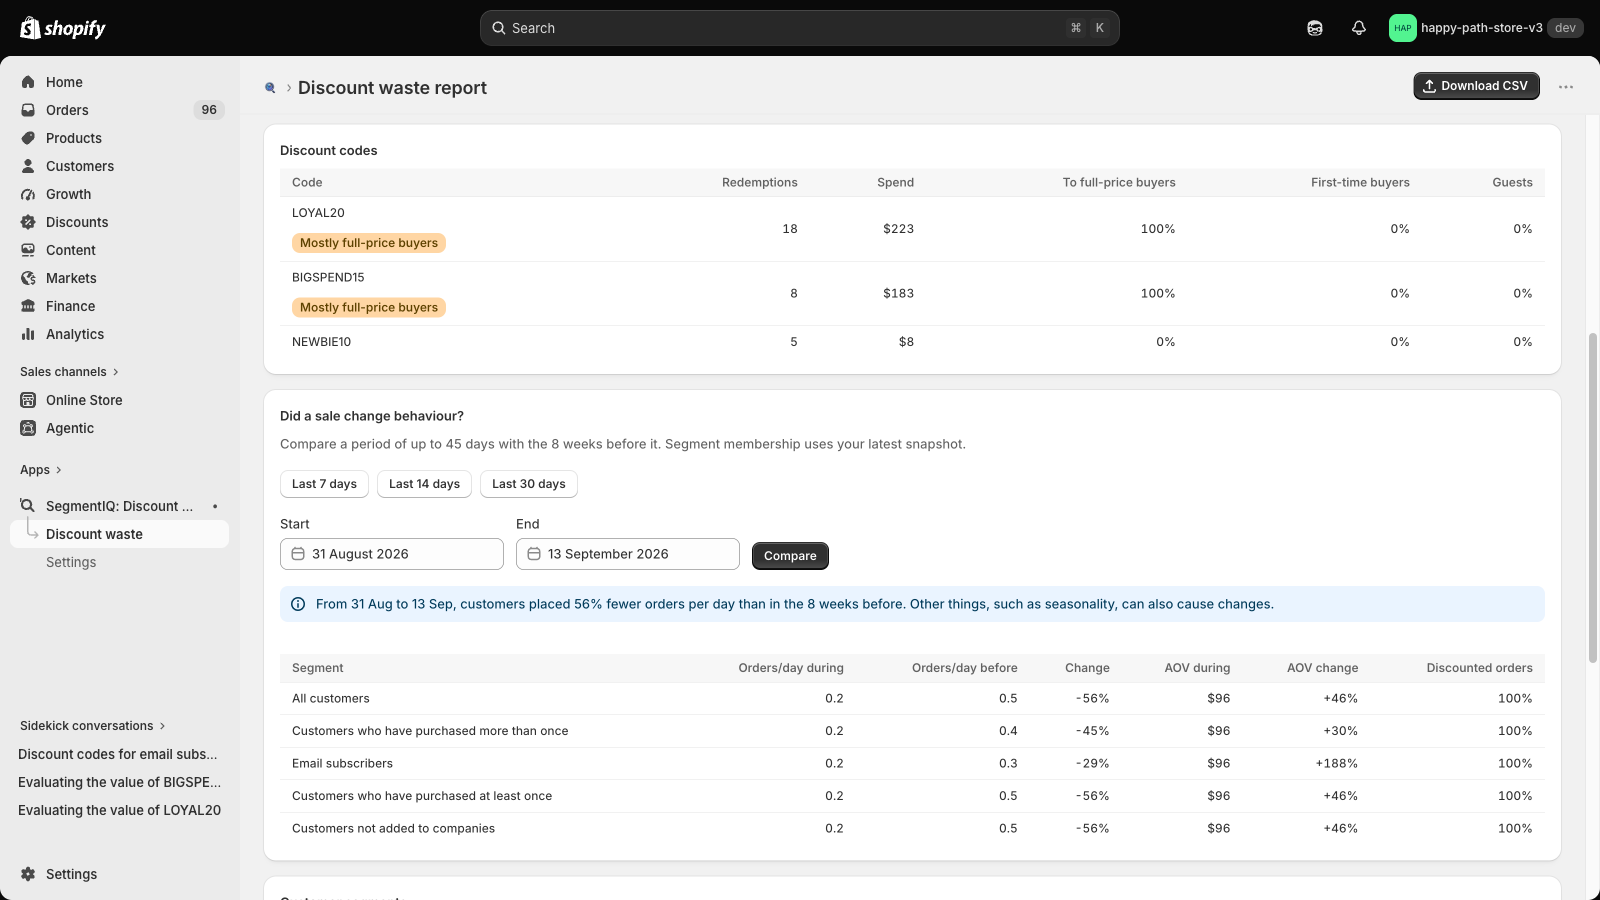
Codes can be flagged:
- Mostly full-price buyers — most of the code's spend went to customers who were already buying at full price
- Possible leak — a code open to all customers that was redeemed mostly by first-time buyers or orders with no customer, which can mean it has been shared on coupon sites
Sale before/after comparison
Pick the start and end dates of a sale (up to 45 days long) and click Compare. SegmentIQ compares daily orders, revenue and average order value during the sale with the 8 weeks before it, for all customers and for each segment. Use it for a Black Friday or seasonal sale post-mortem.
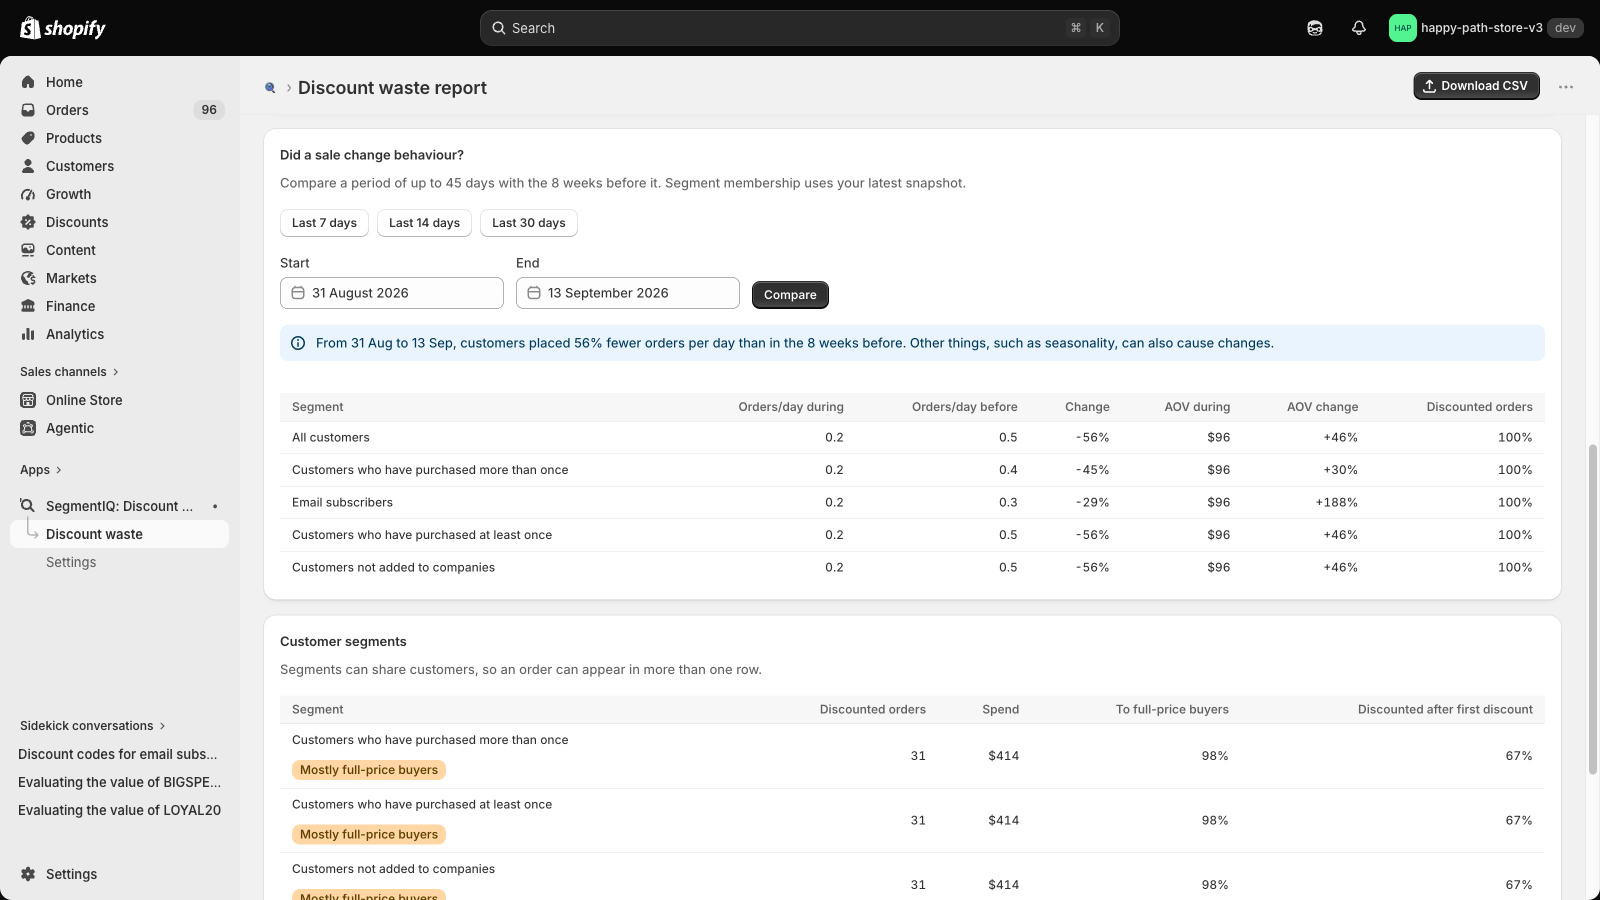
Customer segments
For each segment: discount spend, the share that went to recent full-price buyers, and how often customers keep using discounts after their first discounted order. A high rate suggests the segment has learned to wait for a discount.
Download CSV
Download CSV in the page header exports the report so you can work with it in a spreadsheet.
How we estimate this
A discounted order counts toward "recent full-price buyers" when the same customer placed a full-price order in the previous 180 days. That shows who received a discount, not what the discount caused — some of those customers may still have needed the offer. Treat a high share as a sign worth testing (for example with a smaller offer for part of a segment), not as proof the discount was wasted.
Segments can overlap, so a customer in several segments counts in each of them.